Available on the Enterprise plan. Contact sales to learn more.
Why enable managed metrics
Without metrics visibility, Ona cannot detect runner issues until you report them. Managed metrics close this gap:- Proactive monitoring — Ona detects degraded runners, resource exhaustion, and elevated error rates before developers are impacted.
- Faster incident resolution — When you contact support, the Ona team already has the operational context they need.
- Zero setup on your side — No Prometheus endpoint to configure, no dashboards to build. Toggle it on and the runner handles the rest.
- Non-sensitive data only — The curated metric set contains only operational counters, gauges, and histograms. No user data, source code, or secrets are ever sent.
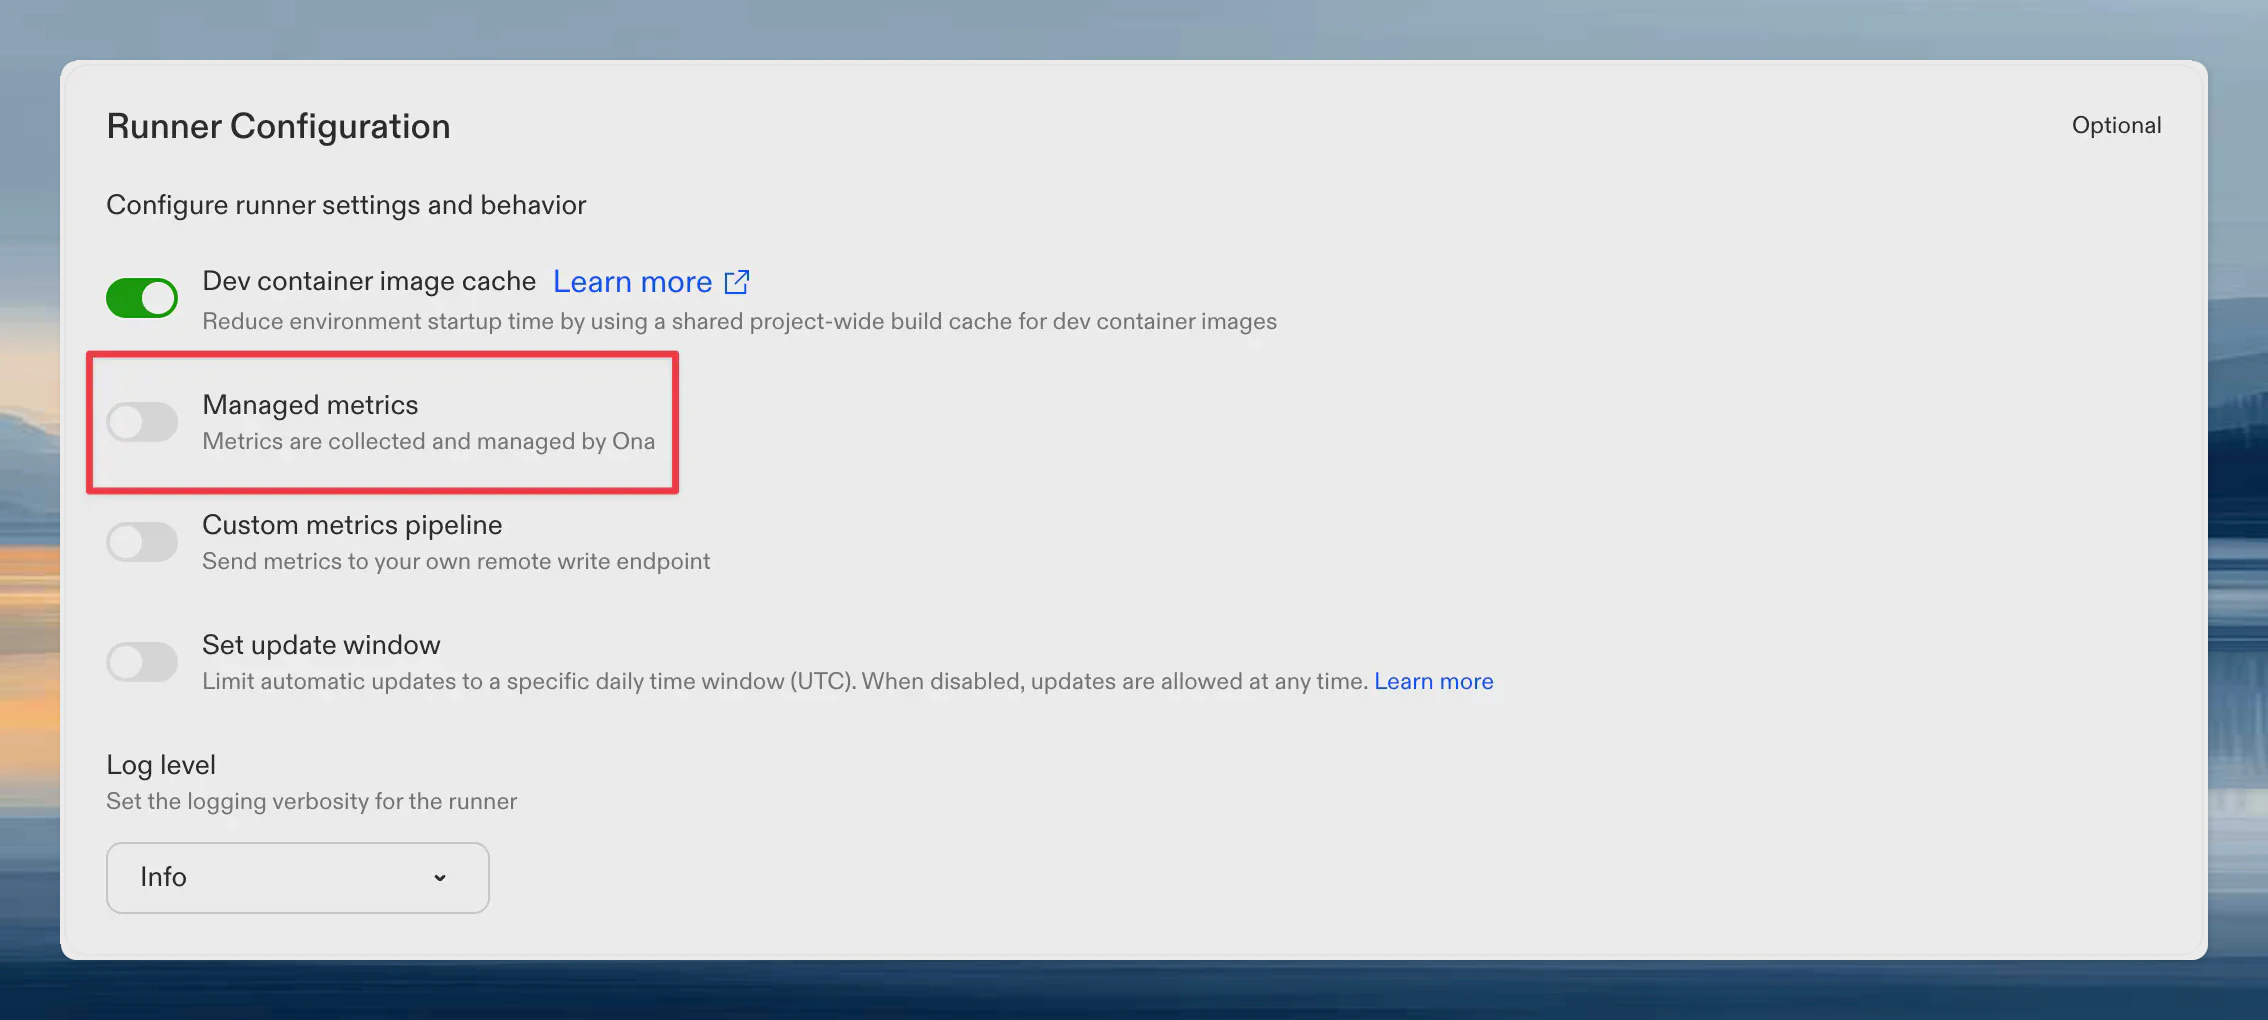
Enabling managed metrics
- Go to Settings → Runners
- Select your runner
- Toggle Ona managed metrics

What metrics are reported
The curated metric set answers: “Is this runner healthy and performing well?” Metrics are filtered to a hardcoded allowlist in the runner binary. Adding or removing metrics requires a runner release, which provides a natural review gate.Environment lifecycle
| Metric | Type | Description |
|---|---|---|
gitpod_runnerkit_active_instances | Gauge | Current environment count by state |
gitpod_runnerkit_environment_operation_duration_seconds | Histogram | Duration of environment operations |
gitpod_runnerkit_function_calls_total | Counter | Total function calls by function name |
gitpod_runnerkit_function_errors_total | Counter | Total function errors by function name |
Supervisor connectivity
| Metric | Type | Description |
|---|---|---|
gitpod_runnerkit_supervisor_status_events_total | Counter | Supervisor status events received |
gitpod_runnerkit_supervisor_watch_closes_total | Counter | Supervisor watch connection closes by reason |
Inverted RPC
These metrics track request delivery from the management plane to the runner over the runner’sWatchRequests stream.
| Metric | Type | Description |
|---|---|---|
gitpod_runnerkit_inverted_rpc_requests_received_total | Counter | Inverted RPC requests and events received by request type |
gitpod_runnerkit_inverted_rpc_async_queue_depth | Gauge | Current number of queued or running asynchronous inverted RPC requests |
gitpod_runnerkit_inverted_rpc_async_queue_capacity | Gauge | Configured asynchronous inverted RPC queue capacity |
gitpod_runnerkit_inverted_rpc_async_queue_enqueues_total | Counter | Asynchronous inverted RPC enqueue attempts by request type and outcome |
gitpod_runnerkit_inverted_rpc_async_queue_wait_duration_seconds | Histogram | Time asynchronous inverted RPC requests spend waiting before handler execution starts |
gitpod_runnerkit_inverted_rpc_handler_duration_seconds | Histogram | Runner-side inverted RPC handler duration by request type and result code |
gitpod_runnerkit_inverted_rpc_send_responses_total | Counter | Attempts to send inverted RPC responses back to the management plane |
gitpod_runnerkit_inverted_rpc_watch_stream_connects_total | Counter | WatchRequests stream connection attempts by delivery path and outcome |
gitpod_runnerkit_inverted_rpc_watch_stream_duration_seconds | Histogram | WatchRequests stream session duration by delivery path and close reason |
Snapshots and warm pools
| Metric | Type | Description |
|---|---|---|
snapshot_reconcile_duration_seconds | Histogram | Snapshot processing time by phase |
snapshot_in_progress | Gauge | Active snapshot operations |
snapshot_timeouts_total | Counter | Snapshot timeouts |
warm_pool_reconcile_duration_seconds | Histogram | Warm pool reconciliation duration |
warm_pool_deletions_total | Counter | Warm pool instance deletions |
Work queue health
| Metric | Type | Description |
|---|---|---|
workqueue_depth | Gauge | Current queue depth |
workqueue_queue_duration_seconds | Histogram | Time items spend waiting in queue |
workqueue_work_duration_seconds | Histogram | Time spent processing items |
workqueue_retries_total | Counter | Processing retries |
LLM proxy health
Scoped to proxy health only. No token counts, no prompts, no usage patterns. Ona can see whether the proxy is succeeding and how fast it responds — nothing about what you send through it.| Metric | Type | Description |
|---|---|---|
gitpod_llm_proxy_requests_completed_total | Counter | Final request outcome (success, exhausted, rejected) per endpoint and model |
gitpod_llm_requests_duration_seconds | Histogram | End-to-end proxy request latency |
gitpod_llm_errors_total | Counter | Provider-side errors returned inside 200 responses, by error type |
gitpod_llm_failover_total | Counter | Failovers between configured LLM providers |
gitpod_llm_input_tokens_total, gitpod_llm_output_tokens_total, cache counters, etc.) are deliberately excluded from the allowlist. They remain available to your own custom metrics pipeline if you want them, but they are never forwarded to Ona.
Agent and MCP
| Metric | Type | Description |
|---|---|---|
gitpod_mcp_* | Various | MCP proxy request duration and count |
gitpod_memory_* | Various | Redis memory usage, eviction cycles, and conversation age |
gitpod_skill_* | Various | Skill API discovery metrics |
Runner operations
| Metric | Type | Description |
|---|---|---|
gitpod_runner_manager_* | Various | Runner manager operational metrics |
gitpod_runner_scm_* | Various | SCM token refresh, cache invalidation, and TTL |
gitpod_runner_updater_* | Various | Runner self-update duration and count |
gitpod_ip_allocator_* | Various | IP address allocation metrics |
gitpod_kvstore_* | Various | Key-value store operation metrics |
Process health
| Metric | Type | Description |
|---|---|---|
go_goroutines | Gauge | Current goroutine count |
go_memstats_alloc_bytes | Gauge | Allocated heap memory |
process_cpu_seconds_total | Counter | Total CPU time consumed |
Cloud-specific metrics
- AWS
- GCP
| Metric | Type | Description |
|---|---|---|
gitpod_ec2_runner_* | Various | EC2 runner operational metrics |
gitpod_ecs_task_* | Gauge / Counter | Task-level CPU, memory, and network usage from the ECS Task Metadata Endpoint |
gitpod_ecs_container_* | Gauge / Counter | Per-container CPU, memory, and network usage within the runner task |
environment_error_errors_total | Counter | Environment errors by code and component |
How it works
- The runner’s Prometheus registry collects metrics every 15 seconds (this already happens for normal runner operation).
- A managed metrics reporter filters the registry to the curated allowlist, encodes the result as a Prometheus remote write payload, and compresses it with Snappy.
- The runner pushes the compressed payload to the Ona management plane every 60 seconds over the existing authenticated connection.
- The management plane validates the payload, adds identifying labels (
organization_id,runner_id,runner_region,runner_type), and forwards it to Ona’s internal monitoring infrastructure.
Auditing reported metrics
Every metrics payload the runner sends to Ona is also written to your cloud storage bucket, so you can audit exactly what data leaves your network. Audit payloads are stored as Snappy-compressed Prometheus remote write protobufs at:Finding the bucket name
The bucket name is shown on your runner’s settings page. When Ona managed metrics is enabled, the bucket URI appears below the toggle. Click the copy icon to copy it.
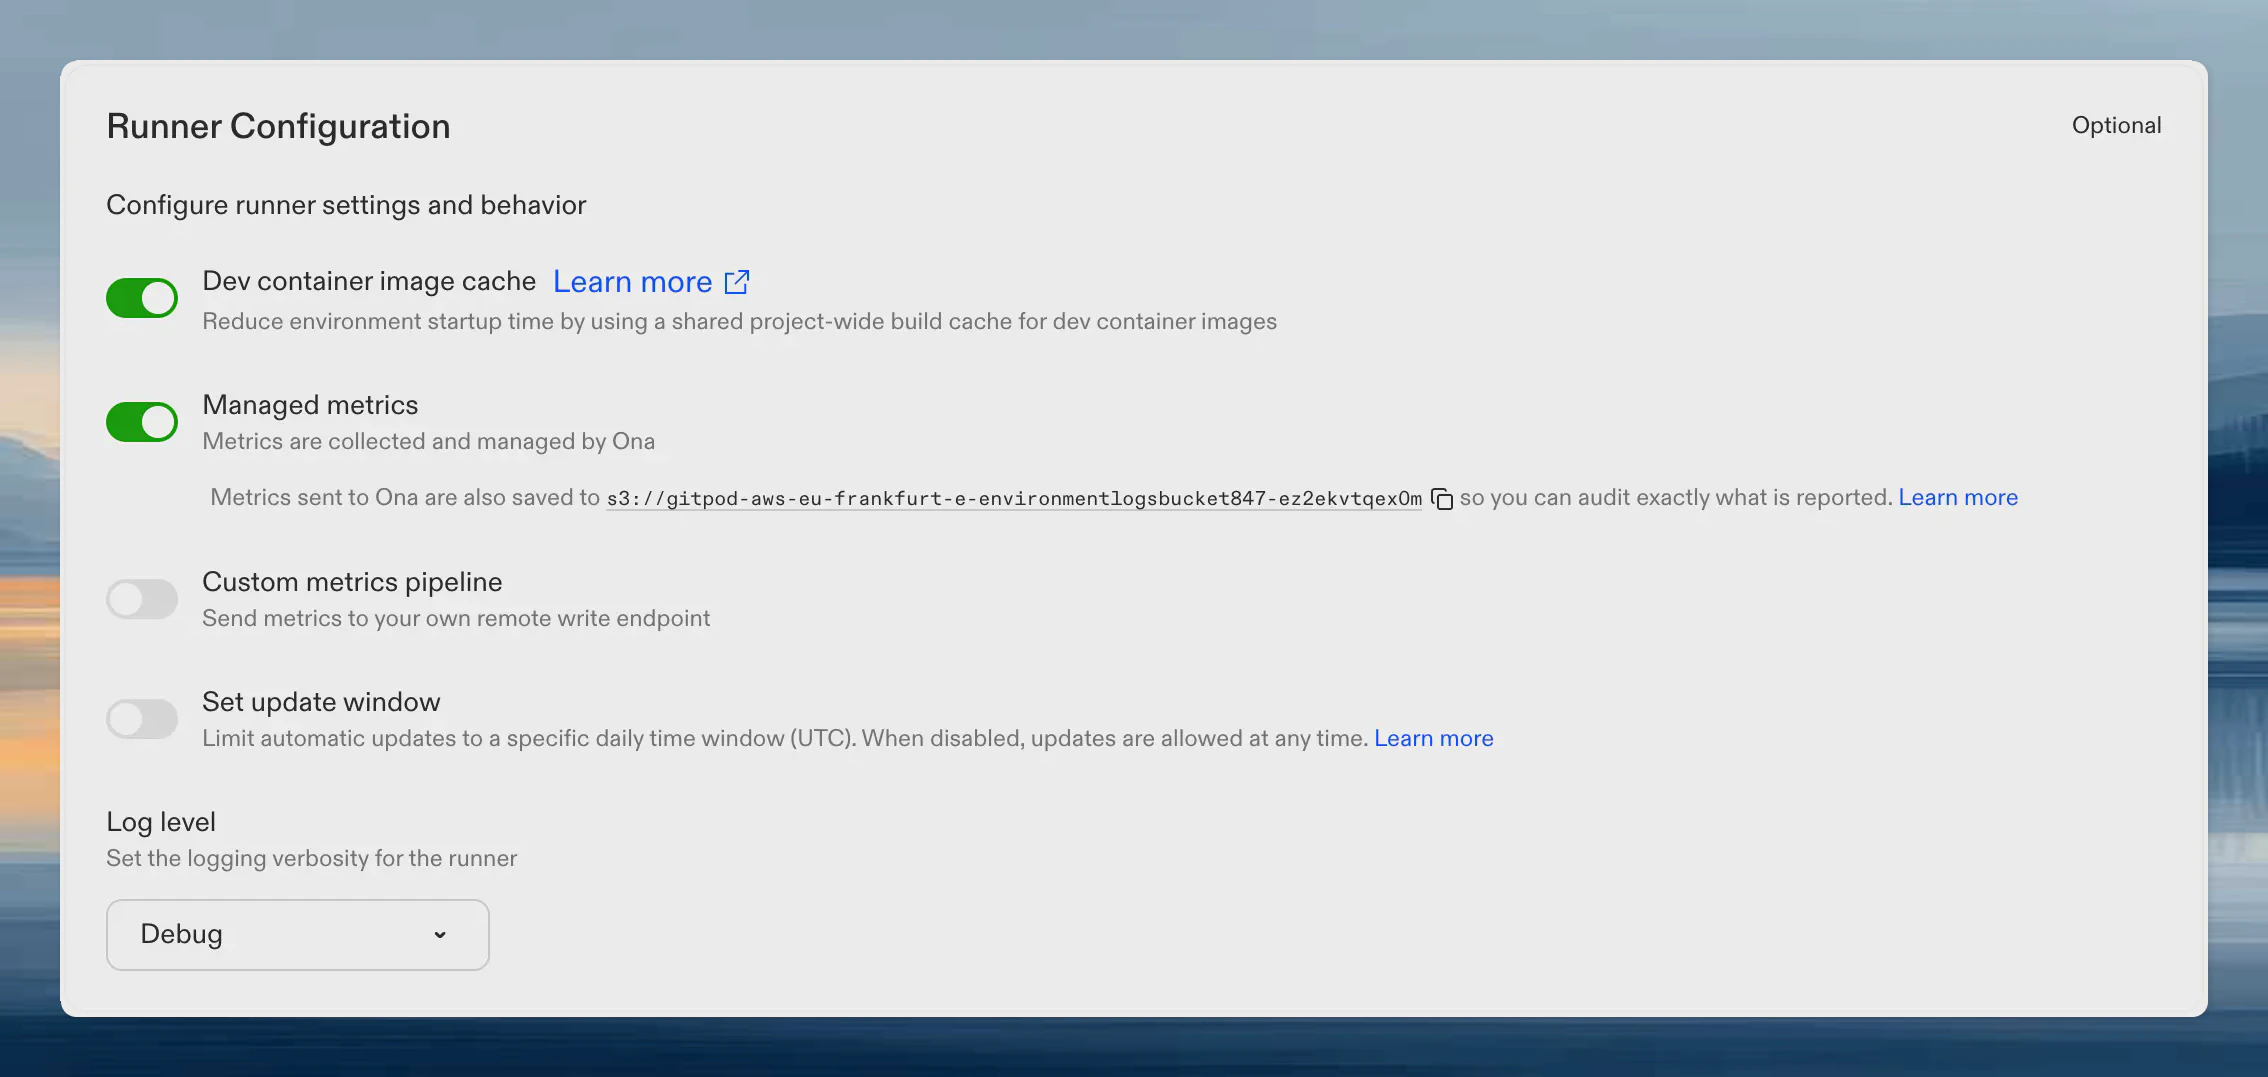
Listing and downloading audit payloads
- AWS
- GCP
Decoding audit payloads
Each.pb.snappy file is a Snappy-compressed Prometheus remote write WriteRequest protobuf. You can decode it with standard Prometheus tooling or any protobuf decoder:
Privacy and data handling
- Opt-in only. Disabled by default. You explicitly enable it per runner.
- Push-based. The runner pushes metrics to Ona. Ona never reaches into your runner or network.
- Non-sensitive. Only operational counters, gauges, and histograms. No user data, source code, environment variables, or secrets.
- Non-interfering. Independent of any self-managed metrics endpoint. Both can run simultaneously.
- Auditable. Every payload is persisted to your cloud storage for inspection.
- Transparent. The metric allowlist is hardcoded in the runner binary. Changes require a runner release and are documented on this page.