Report steps extract structured data from an Automation execution. Define the outputs you want (test coverage, dependency counts, build status), and the agent extracts them using prompts or shell commands. Results appear in a table with CSV export.
Use Report steps when you need to compare metrics across repositories or track values over time. Report results and the performance chart only appear for executions with more than one action. Single-action executions skip the report view.
How it works
- Earlier steps in the Automation do the work (run tests, scan dependencies, build).
- The Report step defines outputs with typed schemas.
- For each output, the agent extracts the value using a prompt or command.
- Results display in a table on the execution summary page.
Add a Report step
In the Automation editor, click + at the bottom of the step list and select Report.
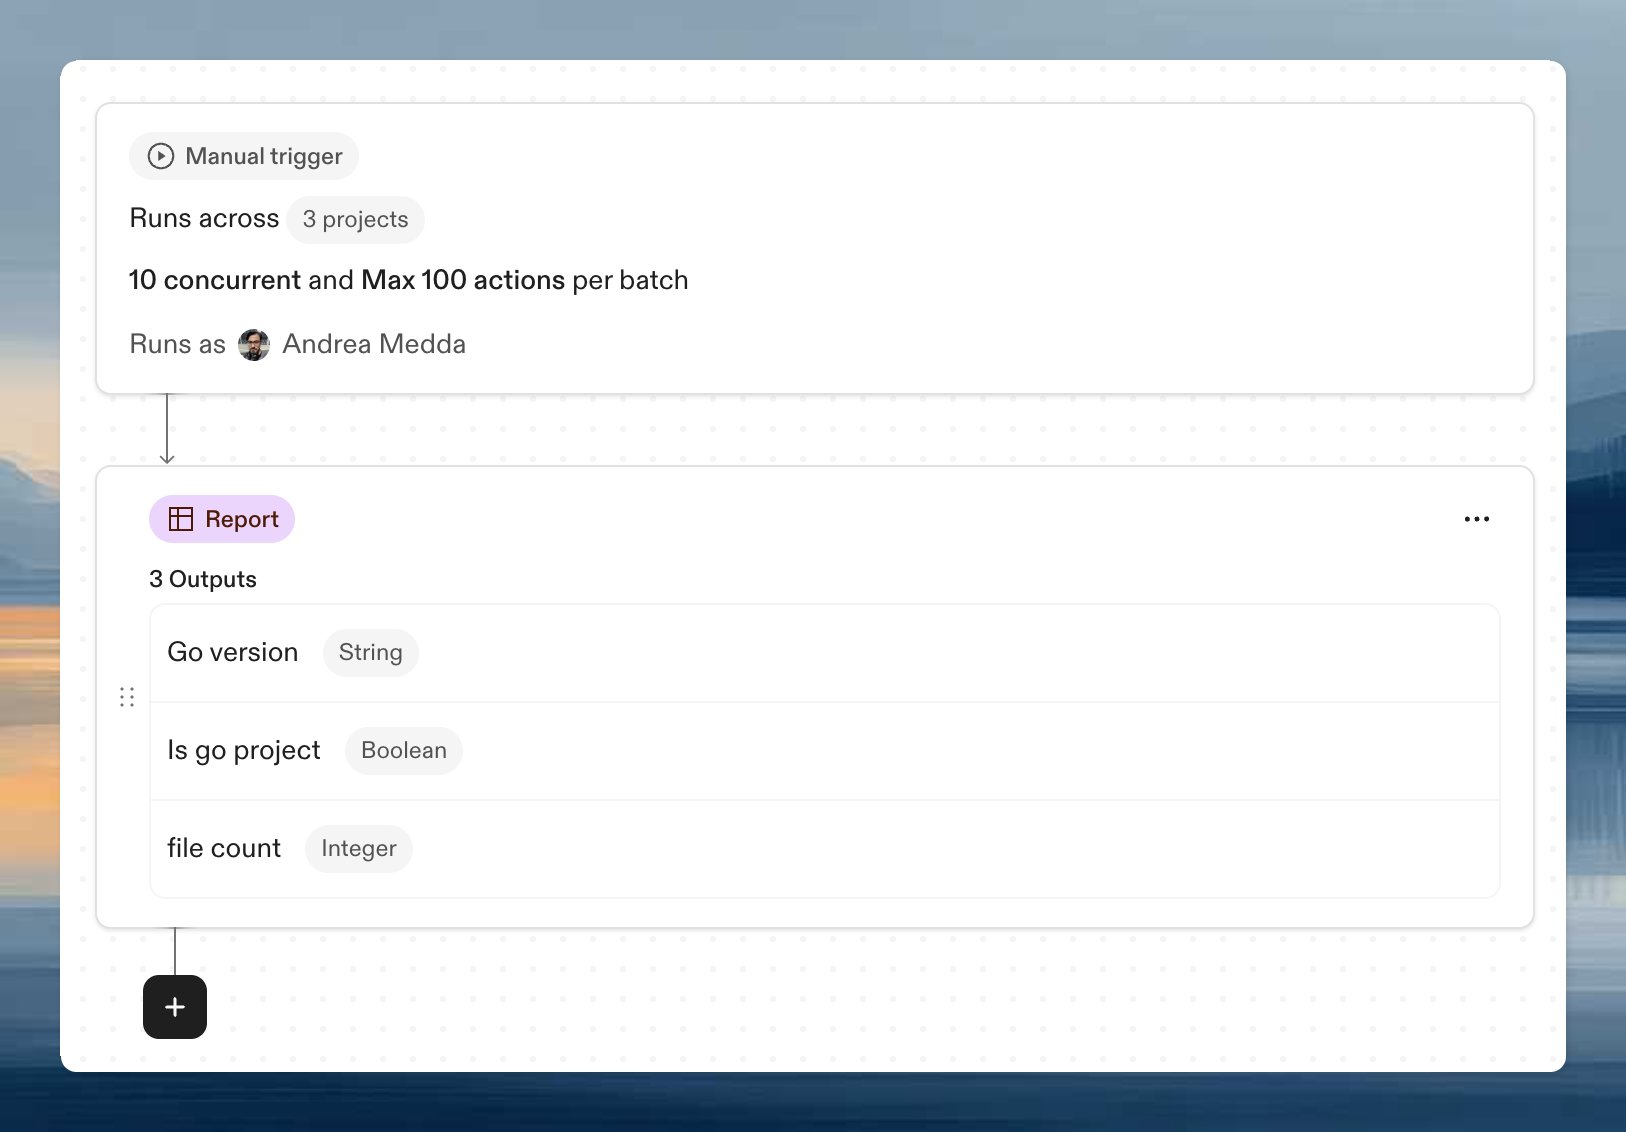
Each output defines one value to extract. A Report step requires at least one output.
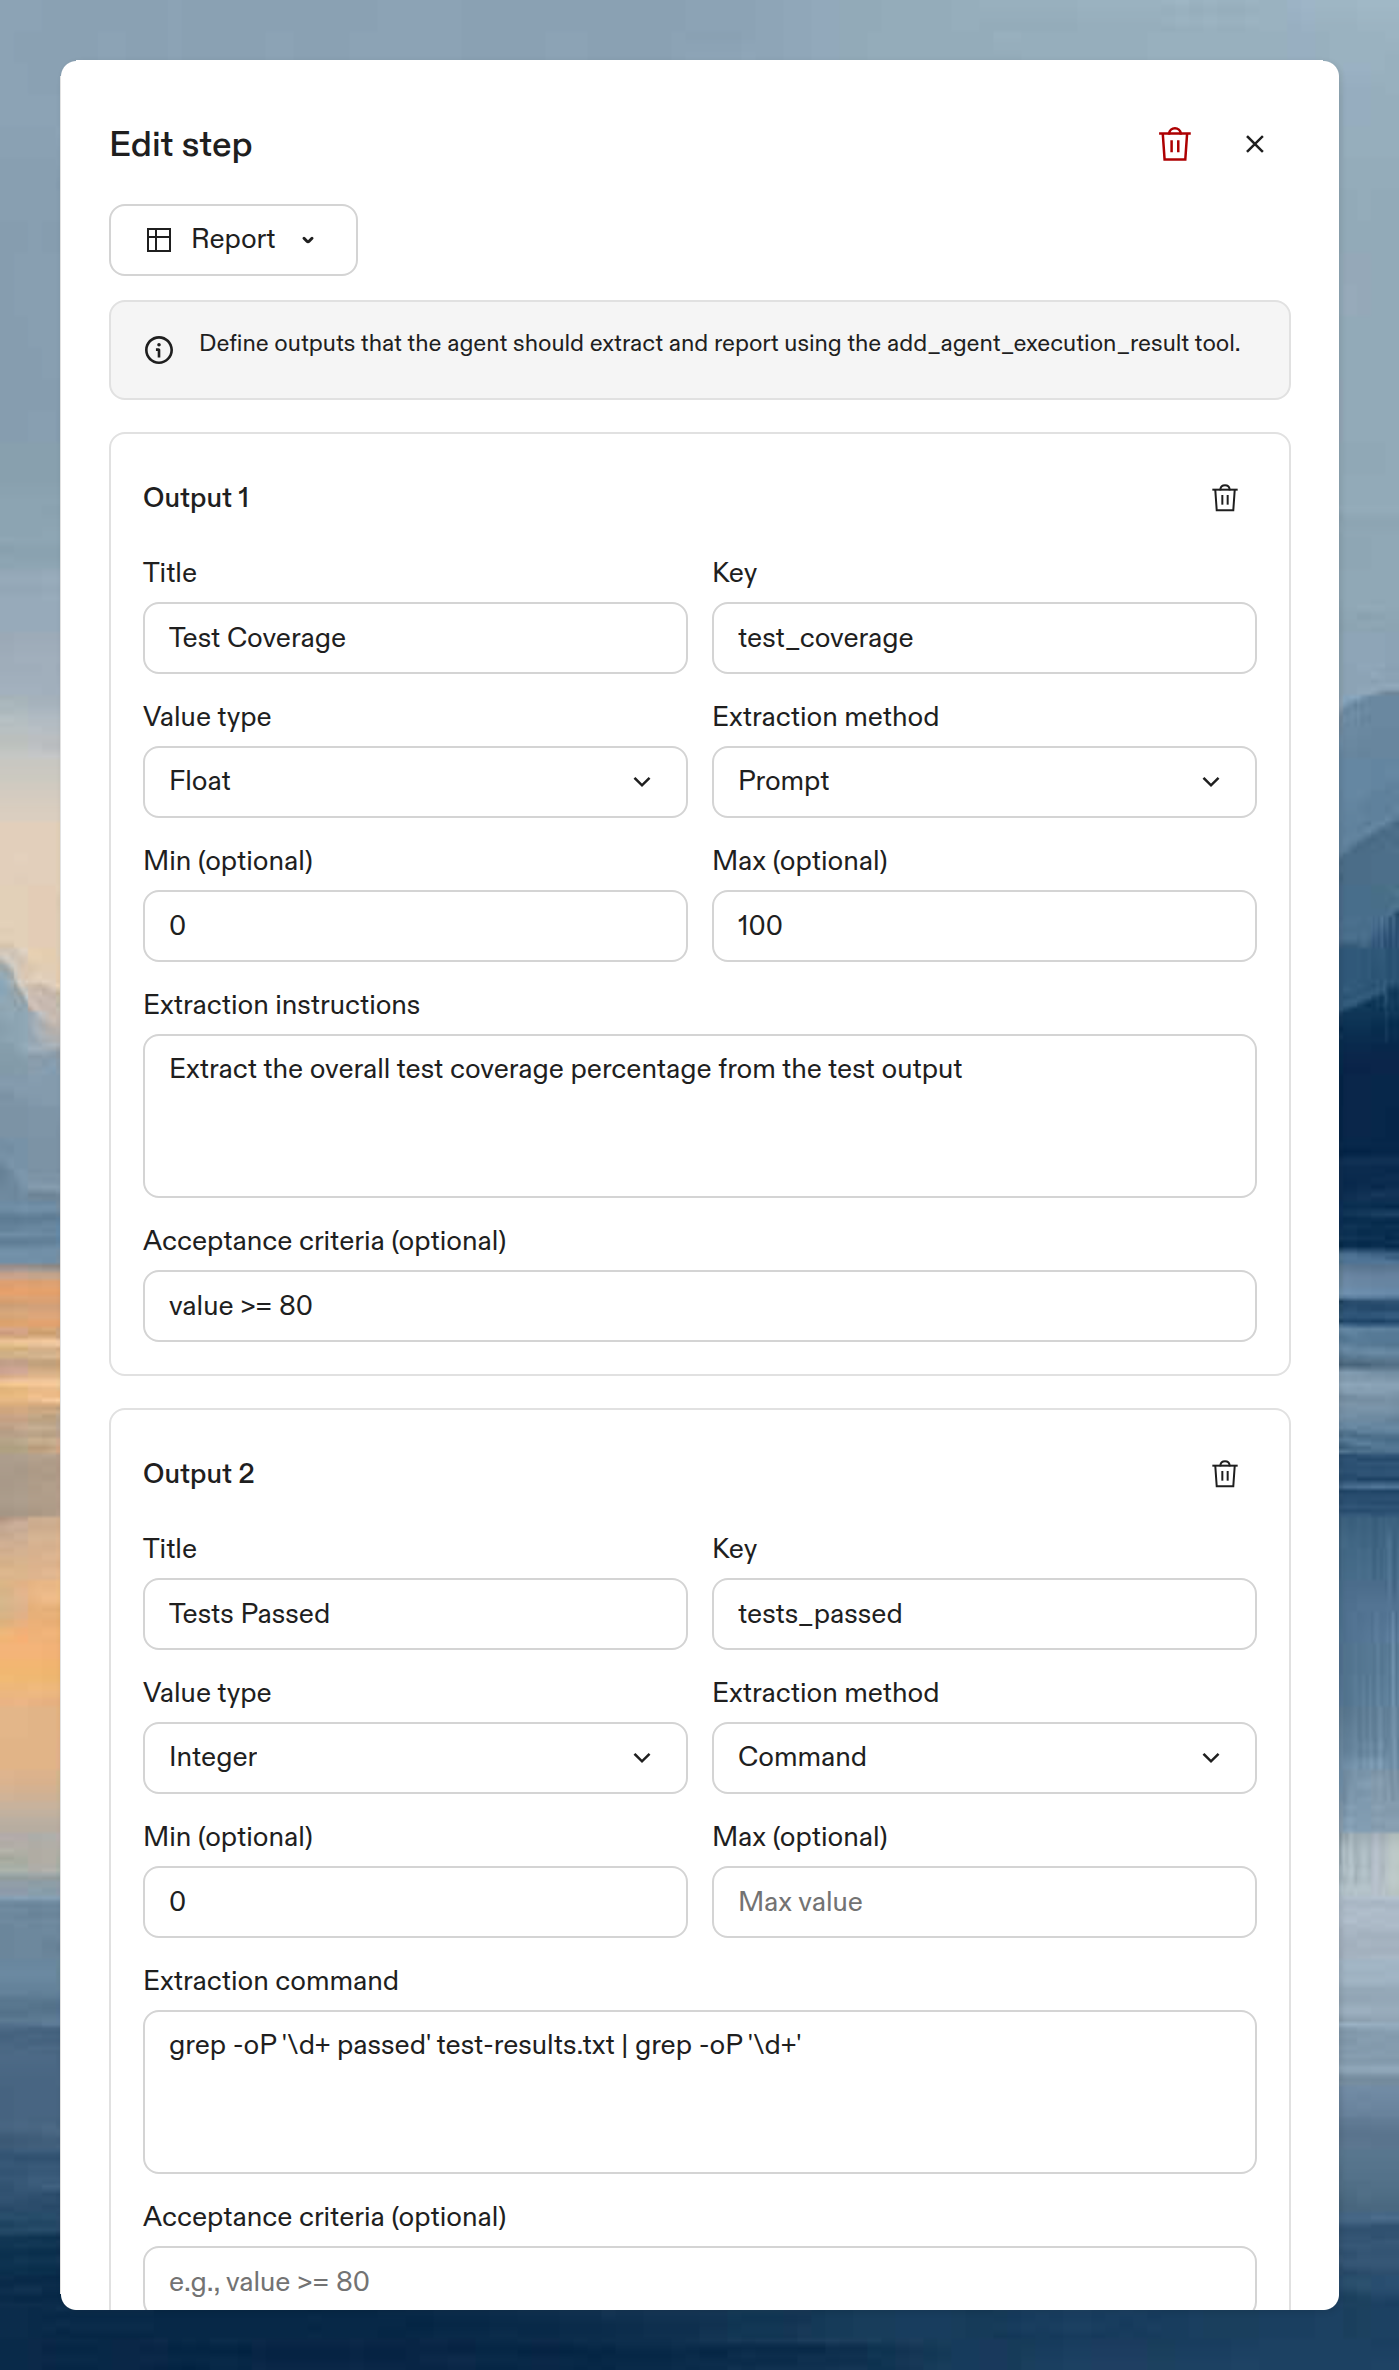
Output fields
| Field | Required | Description |
|---|
| Title | Yes | Display name shown in the results table (max 200 characters) |
| Key | Yes | Identifier in snake_case format, used for CSV export and the add_agent_execution_result tool (max 50 characters) |
| Value type | Yes | Data type for the output value |
| Extraction method | Yes | How to extract the value: prompt or command |
| Acceptance criteria | No | CEL expression that validates the extracted value |
Value types
| Type | Constraints | Results display |
|---|
| String | Optional regex pattern | Plain text |
| Integer | Optional min/max bounds | Number, or progress bar when min and max are set |
| Float | Optional min/max bounds | Number (2 decimal places), or progress bar when min and max are set |
| Boolean | None | Green check or red cross badge |
When you set both min and max on a numeric type, the results table shows a color-coded progress bar: green above 80%, orange 50-80%, red below 50%.
Prompt: the agent reads the execution context and extracts the value based on your instructions. Use for values that require interpretation.
Extract the overall test coverage percentage from the test output
Command: a shell command that outputs the raw value. Use for values you can parse deterministically.
grep -oP '\d+ passed' test-results.txt | grep -oP '\d+'
Acceptance criteria
Optional CEL expressions that validate extracted values. The expression receives one variable (value) and must return a boolean.
Examples:
| Expression | Validates |
|---|
value >= 80 | Coverage is at least 80% |
value > 0 | At least one test passed |
value == true | Build succeeded |
value.matches("^v[0-9]+\\.[0-9]+$") | Version string matches semver pattern |
View results
After execution, the results table appears on the execution summary page. Each row is one action (repository), and columns are the output keys you defined.
The report table and performance chart only appear for executions with multiple actions. If your Automation targets a single project or repository, the report step runs but results are not displayed in the summary view.
Click Export CSV to download the results as a spreadsheet for further analysis or reporting.
Example: test coverage across repositories
This Automation runs tests across multiple repositories and reports coverage metrics.
Step 1 (Prompt):
Run the test suite with coverage enabled. Use the project's existing test
command. Save the output to test-results.txt.
Step 2 (Report):
| Output | Type | Extraction | Acceptance criteria |
|---|
| Test Coverage | Float (0-100) | Prompt: “Extract the overall test coverage percentage from the test output” | value >= 80 |
| Tests Passed | Integer (min: 0) | Command: grep -oP '\d+ passed' test-results.txt | grep -oP '\d+' | value > 0 |
| Build Success | Boolean | Prompt: “Did the build complete successfully? Answer true or false.” | None |
Schedule this on a weekly trigger to track coverage trends. Export CSV results to build dashboards or feed into other tools.
Next steps