

What agents can do with Sentry
Once connected, agents can:- View issues: Browse and search Sentry issues, including error messages, frequency, and affected users.
- Analyze stack traces: Read stack traces and correlate errors with your codebase to identify root causes.
- Search events: Find specific errors, filter by release or environment, and track regressions.
- Add context: Reference Sentry issues in sessions and link errors to code changes.
Example workflows
Connect Sentry
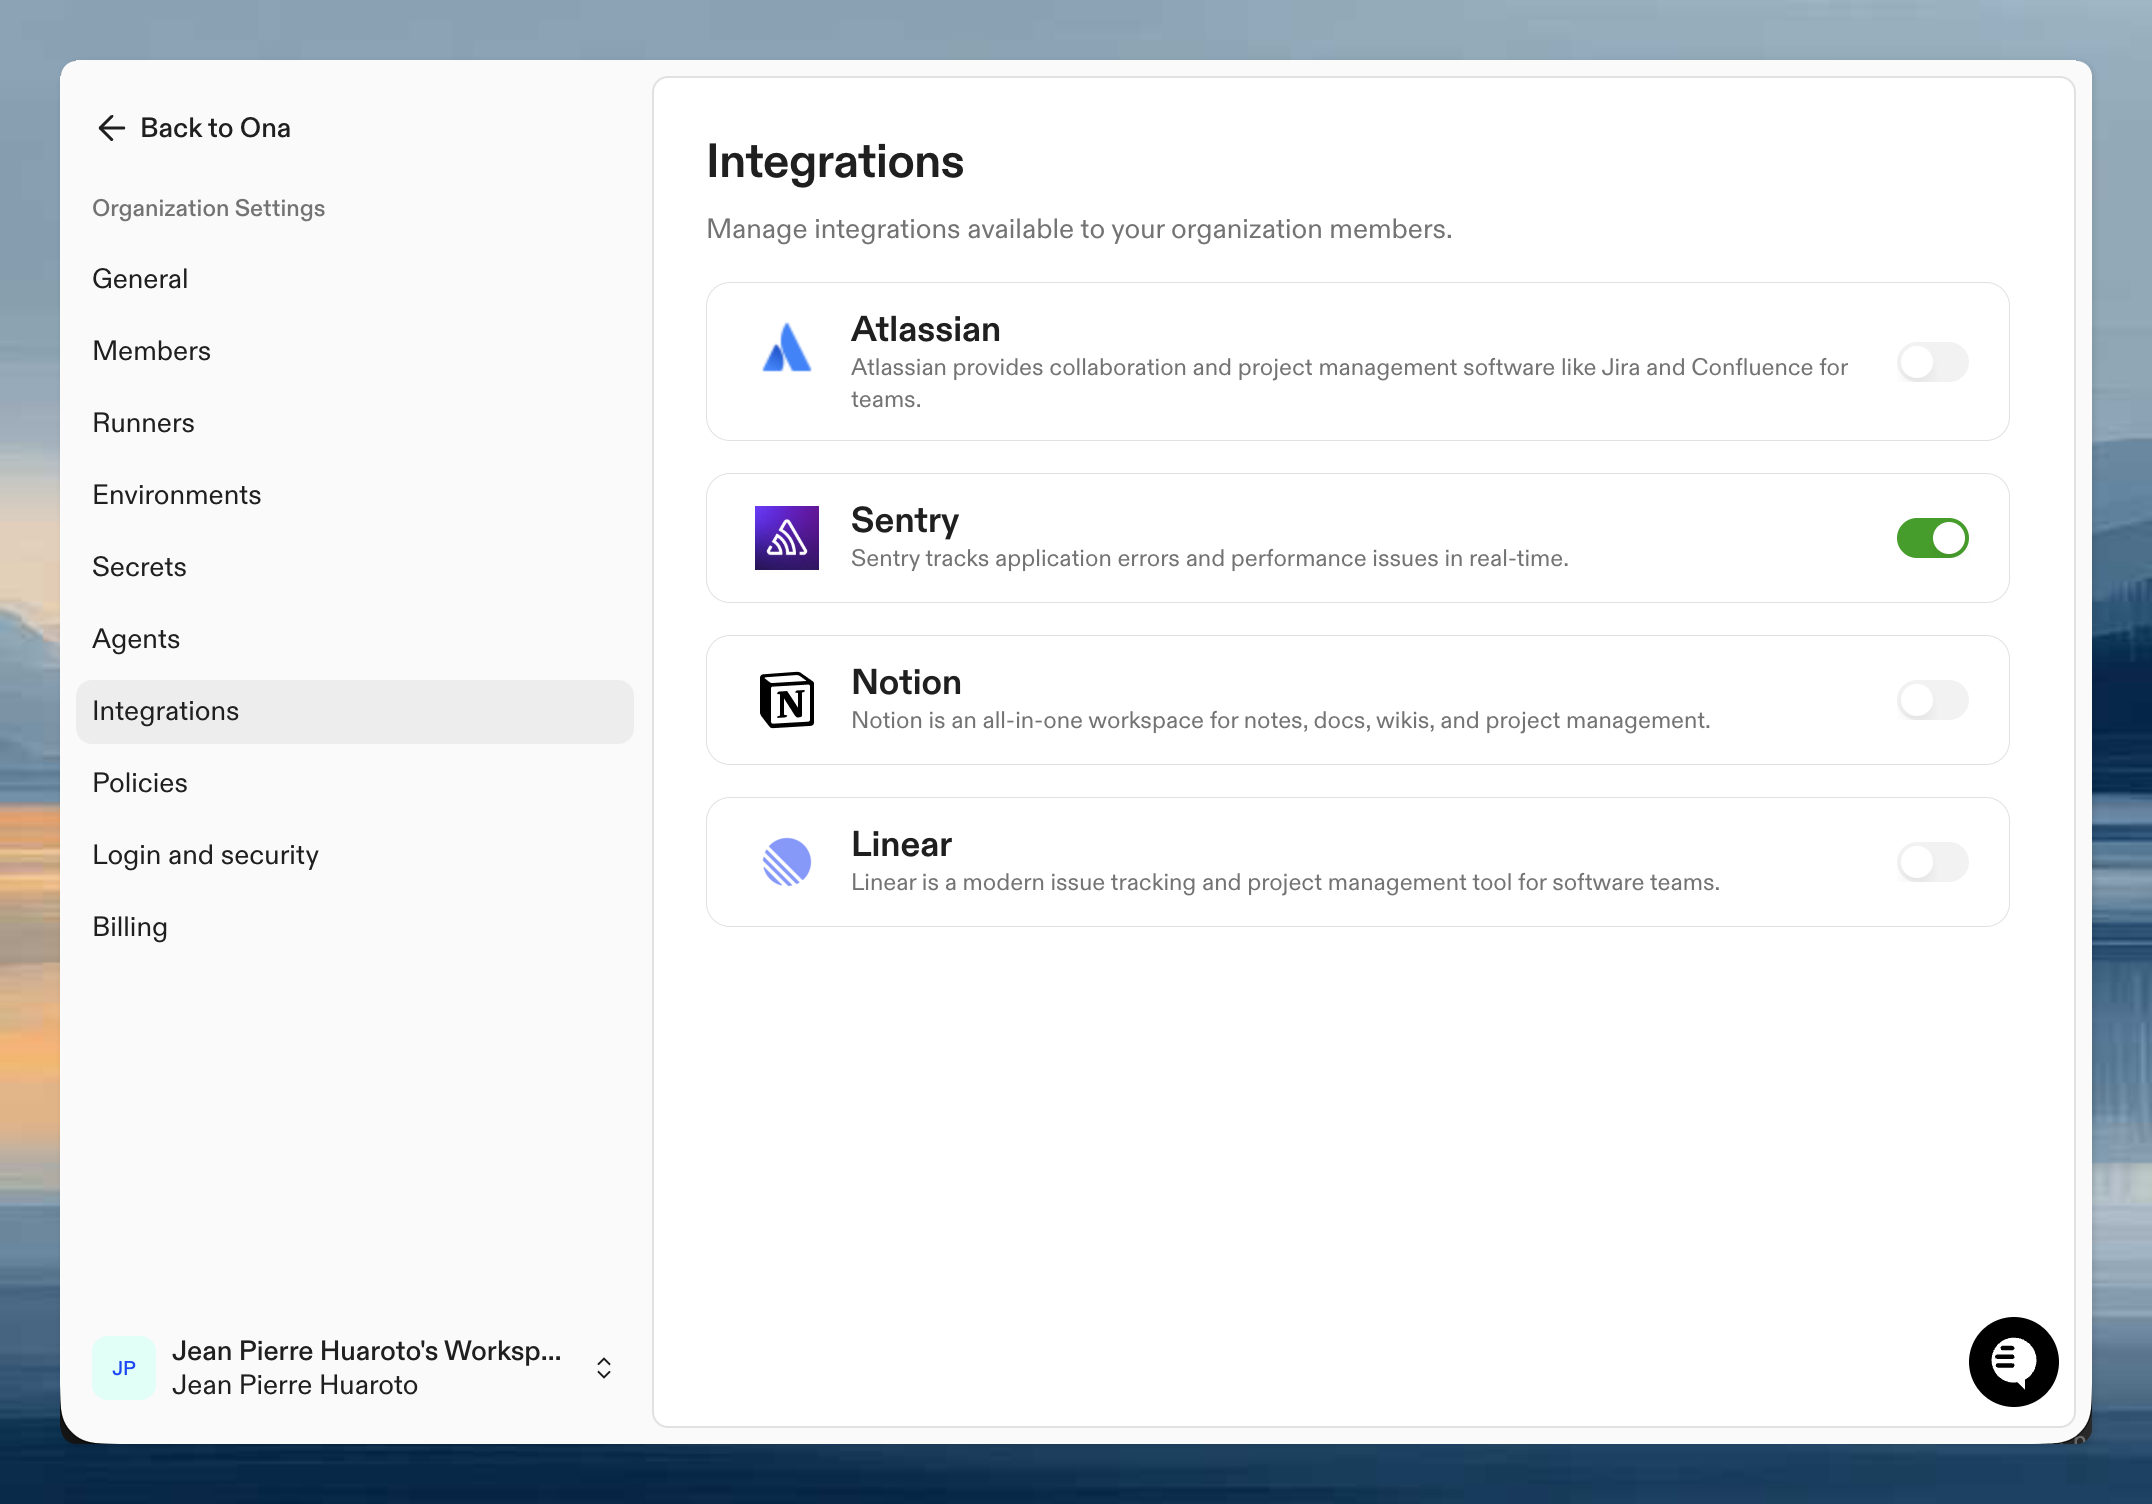
Step 1: Organization setup
An admin needs to enable Sentry for your organization first.- Go to Organization Settings > Integrations
- Find Sentry and click Enable
- Configure default project settings if needed
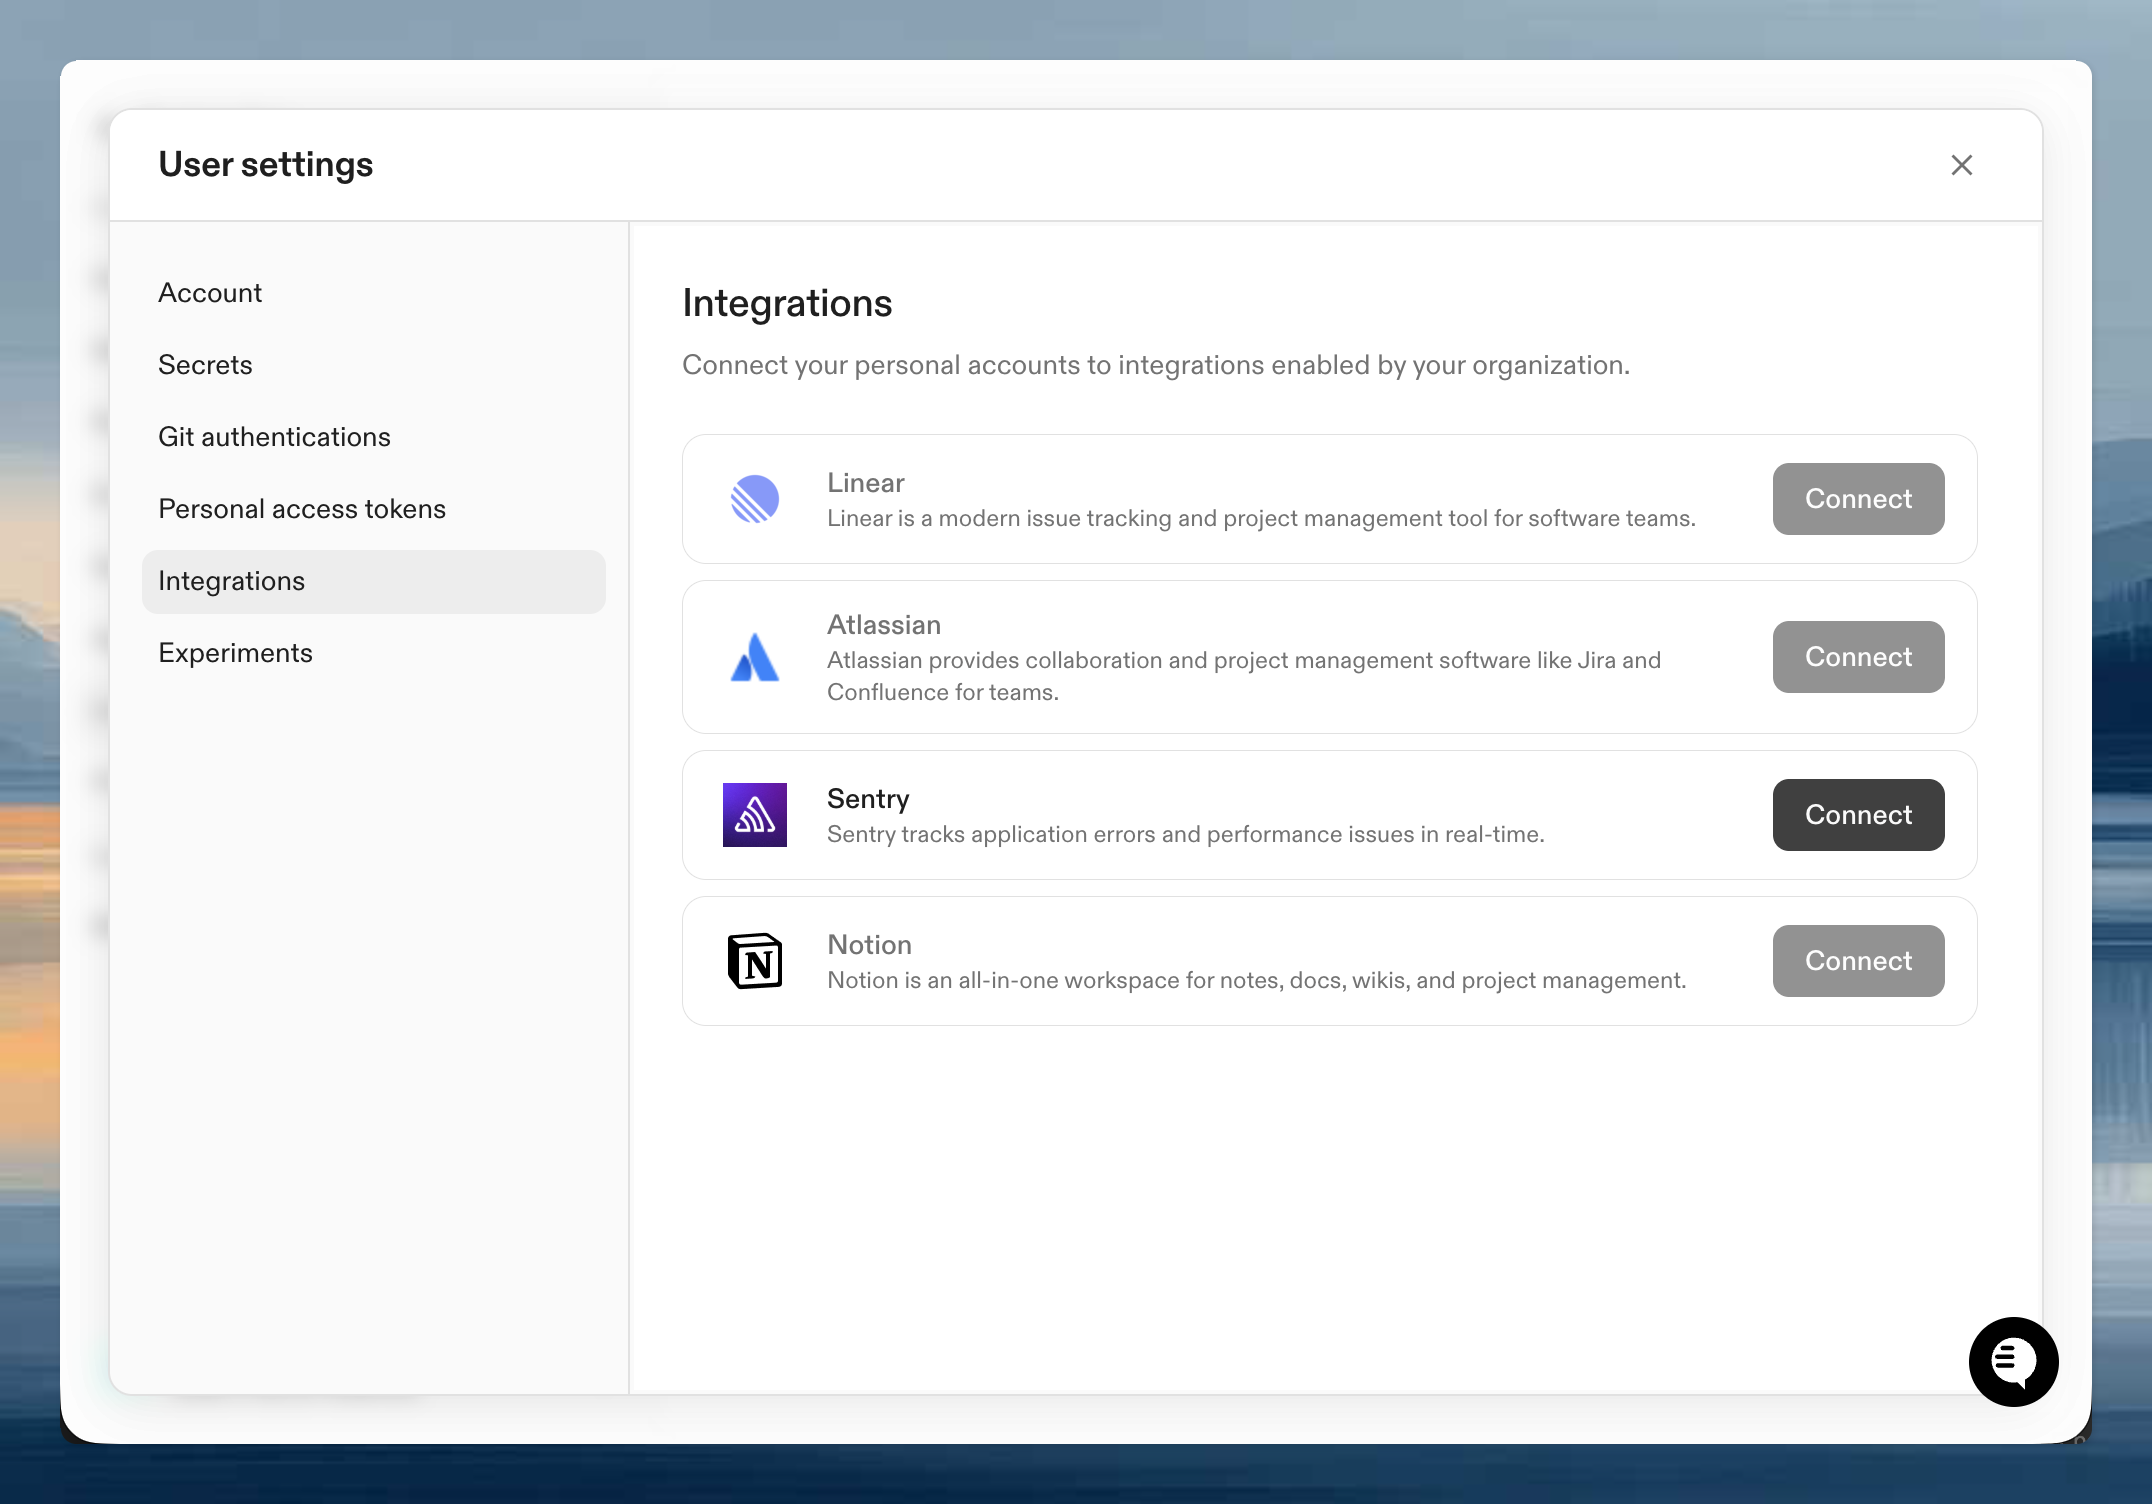
Step 2: Authenticate your account
Once enabled, connect your personal Sentry account:- Go to User Settings > Integrations
- Click Connect next to Sentry
- Authorize Ona to access your Sentry organization
- Select which projects to connect
Verify it works
Start a session with an agent and try:Tips for effective use
Be specific about projects: If you have multiple Sentry projects, specify which one: “Show me errors in the api-server project.” Include environment context: Mention the environment when searching: “Find production errors from the last 24 hours.” Use with AGENTS.md: Add your Sentry project names and conventions to AGENTS.md so agents know your project structure and alerting conventions.Next steps
- Teach agents your codebase including your Sentry project conventions
- Organization-level skills for common workflows like
/error-report - Learn about integrations for other available connections
Troubleshooting
Cannot access a specific project
Cannot access a specific project
Ensure you authorized access to the correct organization and projects during the OAuth flow. You can disconnect and reconnect to update your project selection.